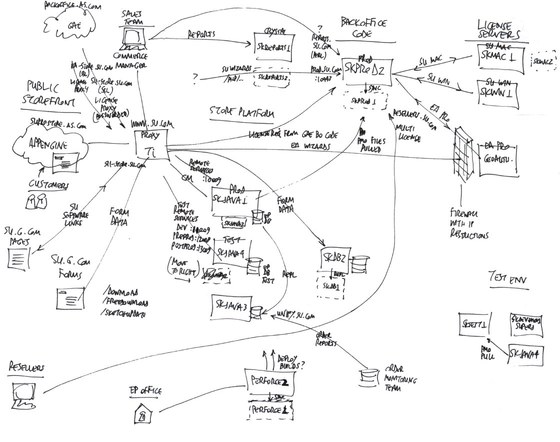
I run some servers for a client, and some new people are taking over the project so they’ve asked me to put together a diagram showing the relationships between the servers and the functions they provide.
This environment has evolved over the past eight years– when I first started working on it there was only a single web server. As the layers have been added and the complexity has grown, some pretty crazy stuff has been put in place. But even I wasn’t prepared for the complexity of the overall ecosystem until I started sketching it:
Yeah.
Now I have to figure out how to organize this into a nice diagram that will make sense to management. Whee.

